Fort Lewis College
About
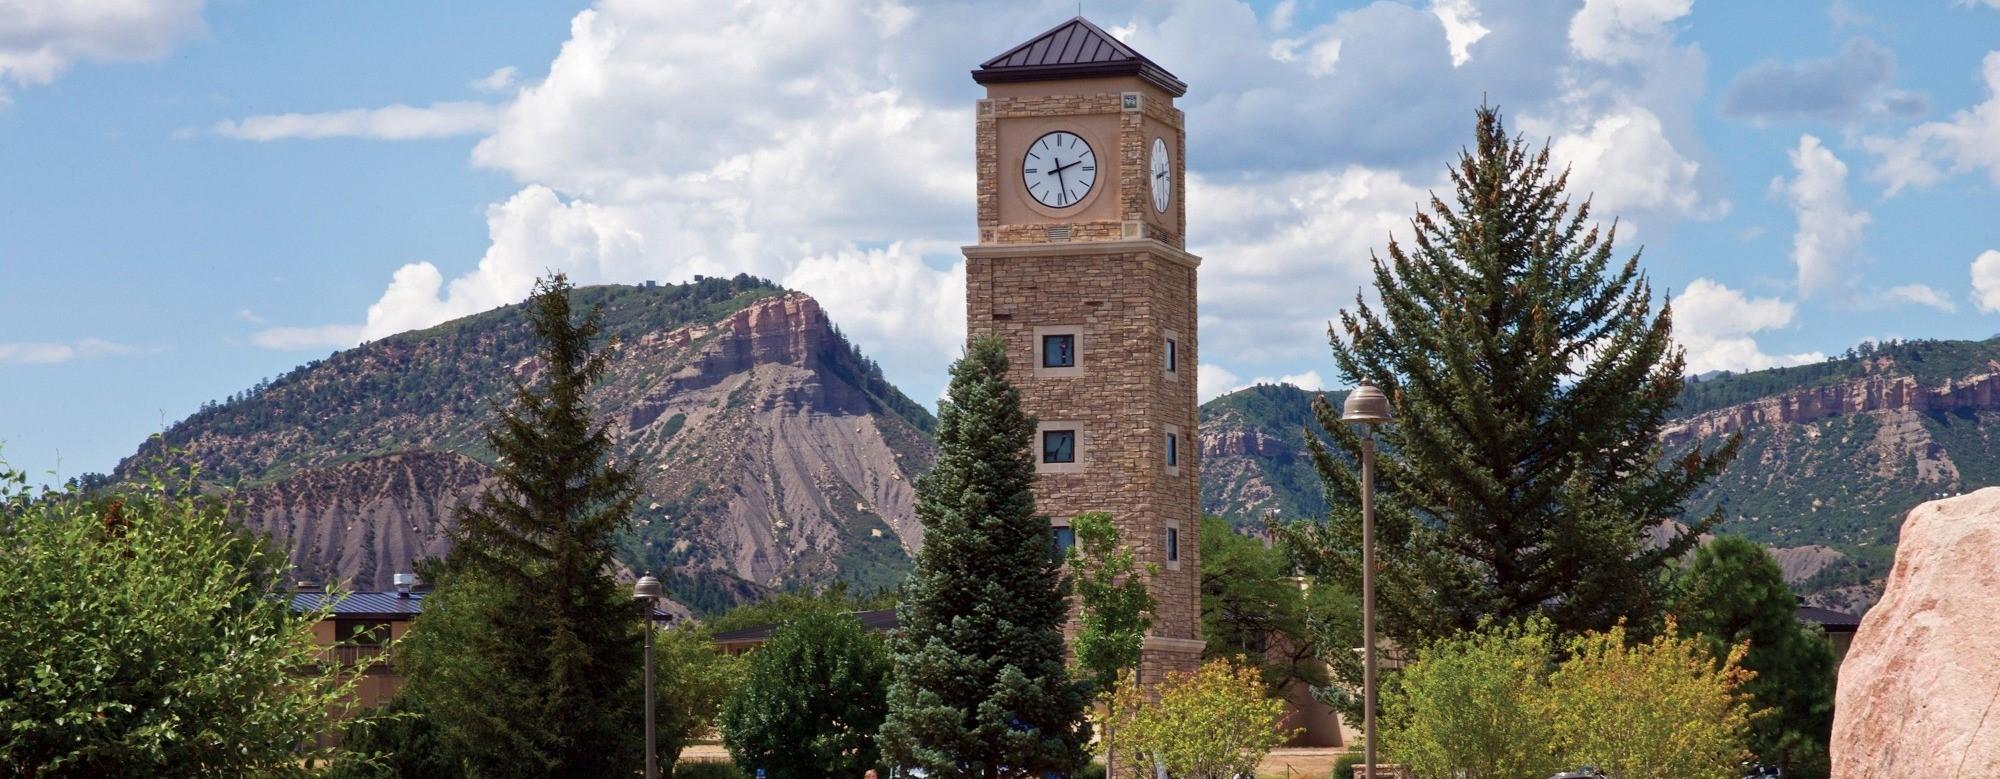
Fort Lewis College is Southwest Colorado's premier public college. Our beautiful mountain campus in Durango, Colorado, inspires an active and friendly community within the Four Corners region, and offers transformative learning experiences that foster entrepreneurship, leadership, and creativity. Our cohorts average 50 students for focused learning and personalized relationships.

Programs
Program Info
Upcoming Deadlines
Deadlines
Program Start
Nov. 15, 2026
FallDec. 01, 2026
SpringJan. 01, 2027
Fall
Get Deadline Reminders
Application Fee & Annual Tuition
Learn how to get$100 Back
and apply for a$1000 Scholarship
$7,853
In State Tuition
$19,551
Out of State Tuition
$40
Application Fee
Ways to Lower Your Costs
Students at Fort Lewis College have reduced the cost of their program using these methods. Check with Fort Lewis College to see if you can, too!
$30,000-$40,000
Grants, Stipends, Scholarships
Students are eligible for Roberta Barr Scholarships up to $30,000 per year NOYCE Science and Math scholarships for $40,000 per year and many others with a total of $80,000.
Loan Forgiveness
Tuition waivers and loan forgiveness programs include the Native American Tuition Waiver, College Opportunity fund and the FLC Tuition Promise.
For more information visit:Financial Aid Office
Licensure Areas
Elementary Education K-6
English Language Arts 7-12
Mathematics 7-12
Music K-12
Physical Education K-12
Science 7-12
Social Studies 7-12
Spanish K-12
TESOL K-12
Theatre
Visual Arts K-12
World Languages K-12
Stats
Male
Female
17%
83%
American Indian or Alaskan Native
Asian
Black
Hispanic/Latino
Native Hawaiian/Other Pacific Islander
White
Two or more races
40%
1%
2%
0%
1%
56%
0%

