
Fort Lewis College
About
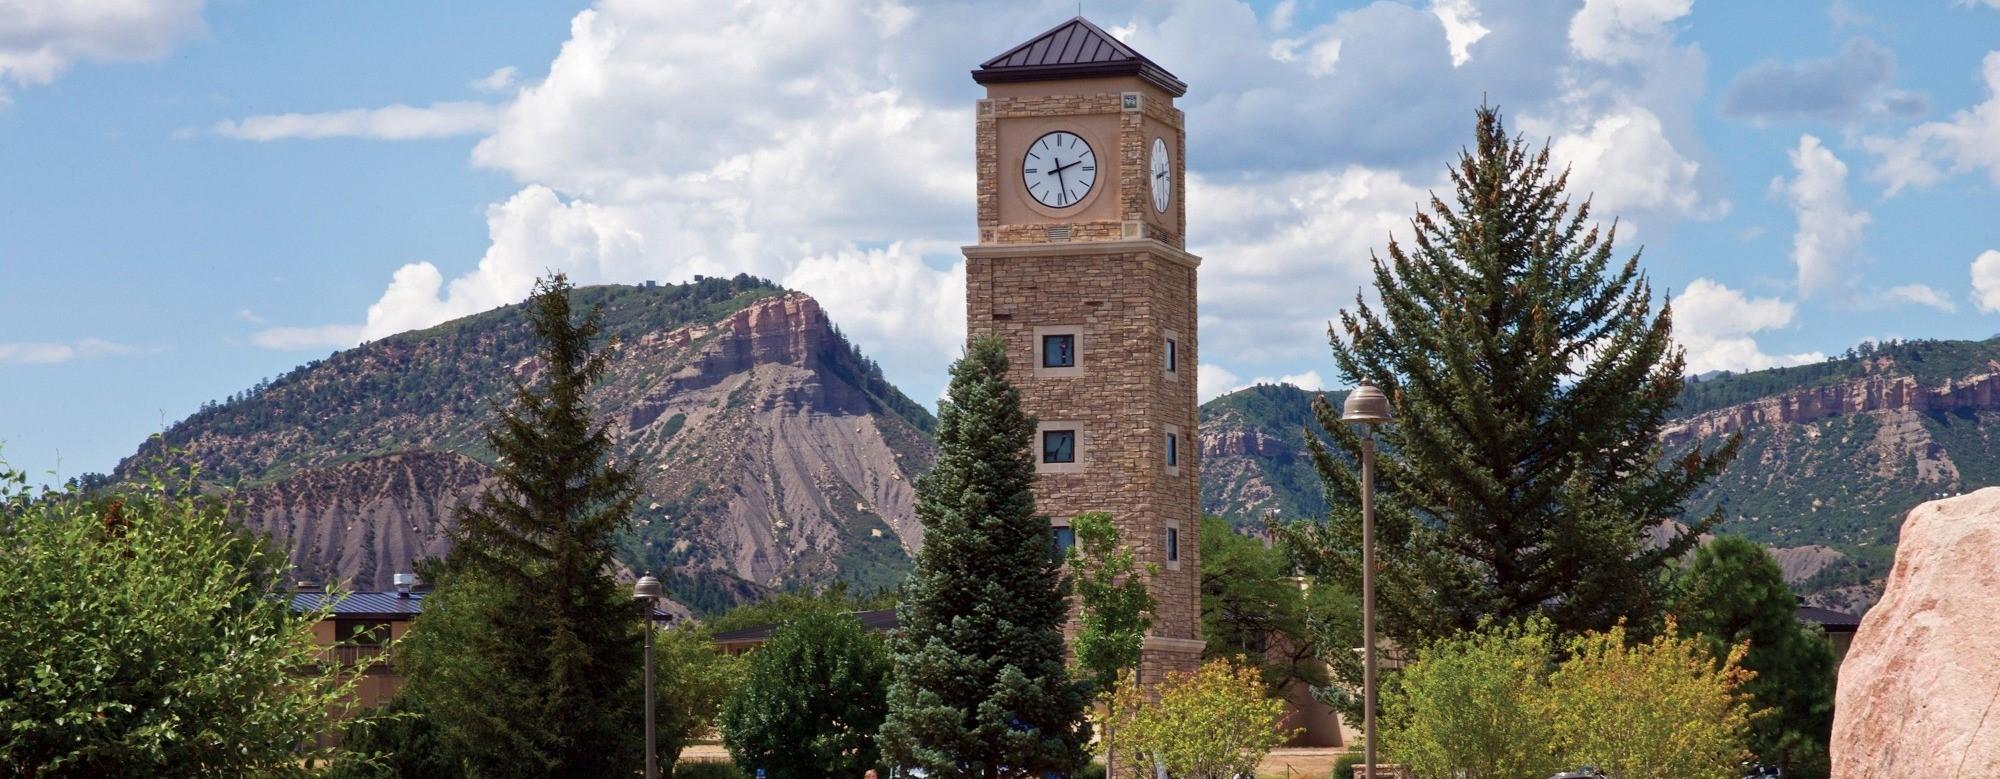
Fort Lewis College is Southwest Colorado's premier public college. Our beautiful mountain campus in Durango, Colorado, inspires an active and friendly community within the Four Corners region, and offers transformative learning experiences that foster entrepreneurship, leadership, and creativity. Our cohorts average 50 students for focused learning and personalized relationships.

The FLC Teacher Education Department has built a close-knit relationship with the local school system. This let me get to know potential employers and coworkers on a deeper level than is possible in a typical Teacher training program, which led to a full time position right out of school.
Dreher Robertson

Programs
From 12 to 48 months
Program Duration
In-person
Program Format
Pre-Test Required
No
Program Info
Upcoming Deadlines
Deadlines
Program Start
Feb. 01, 2026
FallApr. 01, 2026
FallJun. 01, 2026
FallAug. 01, 2026
Fall
Get Deadline Reminders
Ways to Lower Your Costs
Students at Fort Lewis College have reduced the cost of their program using these methods. Check with Fort Lewis College to see if you can, too!
Tuition
$7,853.40
$10,000
Grants, Stipends, Scholarships
The Native American Tuition Waiver allows qualifed Native American graduate students to attend FLC tuition-free. Students can apply for graduate scholarships worth up to $10,000 per year including the Robert & Roberta Barr, STEM Noyce, Make a Difference, Innovative Teacher Leadership, Inclusion Matters, Culturally Responsive Teaching, and Native American Educators as Leaders Scholarships.
Student Loans, Payroll Deduction
FLC offers payment plans to students to cover charges not covered by aid in the fall, spring, and summer semesters.
For more information visit:Financial Aid Office
Licensure Areas
Mathematics 7-12
Music K-12
Physical Education K-12
Science 7-12
Social Studies 7-12
Spanish K-12
TESOL K-12
Theatre K-12
Visual Arts (grades K-12) K-12
Stats
Male
Female
24%
76%
American Indian or Alaskan Native
Asian
Black
Hispanic/Latino
Native Hawaiian/Other Pacific Islander
White
Two or more races
32%
0%
0%
4%
0%
60%
4%
